Navigating the Report Generator
To better follow the instructions below, review the page description in Report Generator.
Use the Report Generator to do the following:
Creating a Report as a Spreadsheet or a Chart
Before creating a report, review the overview in Report Generator.
then do the following:
- Set up Hierarchy and a Date Range for the report.
- Select a program.
- In the upper right corner of the web page, select a survey source or select All. .
- In Report Generator, select a View. For example, select Score.
- Depending on the View you selected, select an Report Filter option from either Group By, or Disposition. For example, select LRS. The selection turns blue
 with a checkmark by it, and a dropdown list appears.
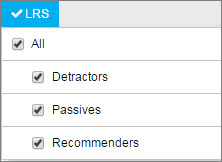
- Select any of the checkboxes in the dropdown list, as shown in Step 5.
 All Report Filters include a dropdown list except for Date, or the CMP, or API checkboxes.
- Do either of the following:
- To select an entire Selection Group, drag the group onto the canvas.
- To select individual Attributes within a group, click a Selection Group and place your mouse on the white arrow or anywhere on the Attribute, then drag the Attribute onto the canvas .For example, drag Purchase LRS.
A checkmark appears by each of the Attributes you selected, for example, .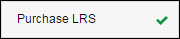 .
.
 To remove unwanted Attributes see the next section, Removing Attributes from the Canvas.
- Click
 , and then in the Report Preview window, view the report, then click Print.
Only the first 10 rows are shown in the preview.
- To save the report, close the Report Preview window, enter a name at untitled template and then click the Save icon.

- To download the report as an Excel file, click the
 icon.
icon.
- To view the report as a chart, click
 .
.
The Create Chart window opens.
- Click the tab for Pie, Line/Column, or Bar.
- In the tab you selected, select the variables you want for the chart, and then click Create Chart.
The chart is displayed.
- Do any of the following:
- To return to the Create Chart window and make changes, click
 .
.
- In the Enter Report Name field, enter a report name and click

To view your saved chart report, go to Menu > Extract Tools > Report Generator-My Report.
- Click
 .
.
- To include the report image in an email, click
 .
.
Enter the email address, subject, and message, and then click  .
.
- To return to the canvas, click
 .
.
Removing Attributes from the Canvas
To remove Attributes from the canvas during report creation:
- To remove individual Attributes, do either of the following:
- Hover over an Attribute,
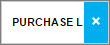 then click the white X that appears.
- Drag the Attribute into the
 icon at the bottom of the page.
- To remove all Attributes from the canvas, click the icon.
The image changes to 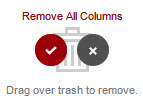
- Click the red checkmark.
All Attributes are removed from the canvas.
Updating Saved Reports
You can update a report you have previously saved as:
To update a report that you saved as a template:
- Click the down arrow near the Save icon
 , then select the report from the dropdown list.
- To modify the report, do any of the following:
- Add or remove attributes in the report.
- Depending on the report's View, change the selection at Grouped by or at Disposition.
- Click the Save icon.
- To clear the canvas and create a new report, do either of the following:
To update the date range in a report you saved as a chart:
- Go to Menu > Extract Tools > Report Generator-My Report.
A list of your saved chart reports is shown.
- Open the report you want to view and change the date range.
In a saved chart report, changing the date range is the only update available.
See also:
Report Generator